Statewide residential median sale price - excluding New York City
The residential median sale price is calculated using all non-condo, arms-length sales from January 1st of any given year to January 1st of the following year. These sale prices are arrayed from lowest to highest. The middle value of the data set is the median sale price for that given year's data.
| Calendar year | Median sale price |
|---|---|
| 1997 | $120,000 |
| 1998 | $126,000 |
| 1999 | $130,000 |
| 2000 | $135,000 |
| 2001 | $144,000 |
| 2002 | $159,900 |
| 2003 | $175,500 |
| 2004 | $195,000 |
| 2005 | $219,000 |
| 2006 | $209,900 |
| 2007 | $202,000 |
| 2008 | $185,000 |
| 2009 | $175,550 |
| 2010 | $189,500 |
| 2011 | $189,000 |
| 2012 | $190,500 |
| 2013 | $206,000 |
| 2014 | $209,000 |
| 2015 | $215,000 |
| 2016 | $229,900 |
| 2017 | $234,300 |
| 2018 | $240,000 |
| 2019 | $250,000 |
| 2020 | $280,000 |
| 2021 | $305,000 |
| 2022 | $310,000 |
| 2023 | $325,000 |
| 2024 | $331,500 |
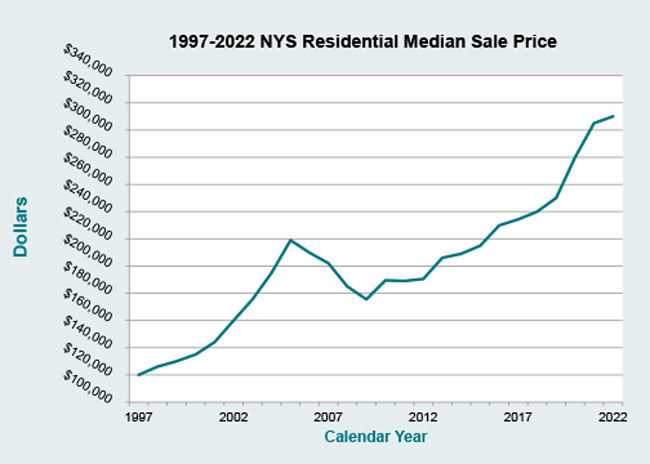
General trend: Median sales prices for homes in New York have been increasing since 1997. There was a decrease between the years 2006 and 2009 before sales began to increase again. By 2016 median sales were above 2005 values.
Updated: